Workplace fatalities statistics UK
Every year, the Health and Safety Executive publishes its annual figures on work-related deaths in Great Britain. These statistics are among the most closely scrutinised in the field of occupational health and safety — cited by law firms pursuing prosecutions, unions campaigning for stronger protections, journalists covering workplace tragedies, and safety professionals benchmarking performance across industries.
The headline number — workers killed by workplace accidents — tells only part of the story. When occupational diseases caused by past exposures are included, the true annual toll of work-related death in the UK rises from hundreds to thousands. Understanding both figures, and the context behind them, is essential for anyone working in health and safety, employment law, HR, or related fields.
This guide brings together the latest verified UK workplace fatality statistics from the HSE, presented clearly and comprehensively so that employers, safety professionals, legal practitioners, journalists, and workers have a single authoritative reference point.
Key facts & figures (overview)
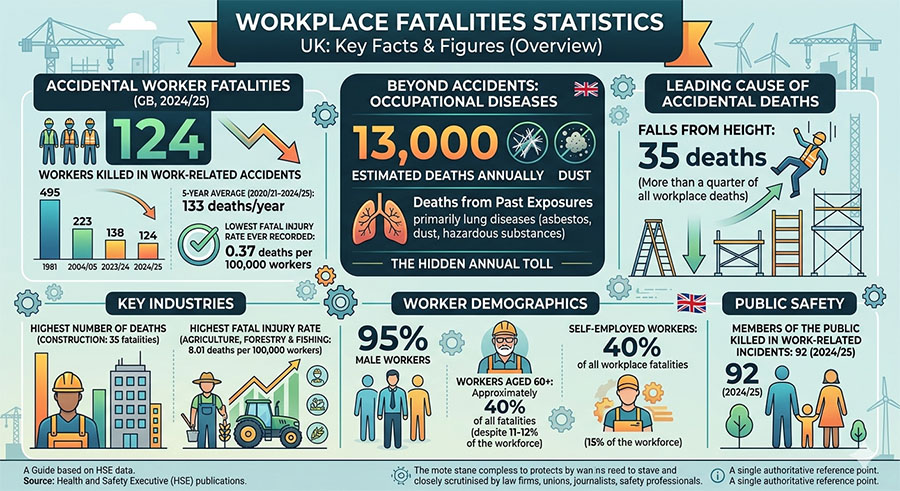
- 124 workers were killed in work-related accidents in Great Britain in 2024/25 — the lowest fatal injury rate ever recorded, at 0.37 deaths per 100,000 workers.
- 138 deaths in 2023/24, compared with 223 in 2004/05 and 495 in 1981.
- 133 deaths per year — the five-year average (2020/21–2024/25).
- 92 members of the public were killed in work-related incidents in 2024/25.
- 35 deaths from falls from height — the leading cause, more than a quarter of all workplace deaths.
- 35 fatalities in construction — the highest number of deaths of any sector.
- 8.01 deaths per 100,000 workers in agriculture, forestry and fishing — by far the highest fatal injury rate relative to workforce size.
- 95% of workplace fatalities were to male workers.
- ~40% of all fatalities were workers aged 60 and over, despite making up just 11–12% of the workforce.
- 15% of the workforce are self-employed, yet they account for 40% of all workplace fatalities.
- ~13,000 people die every year from occupational diseases linked to past workplace exposures — primarily lung diseases caused by asbestos, dust, and other hazardous substances.
How many workers are killed each year?
The HSE’s annual fatality statistics cover work-related deaths reported under RIDDOR (the Reporting of Injuries, Diseases and Dangerous Occurrences Regulations) during the period April to March each year.
In 2024/25, 124 workers were killed in work-related accidents across Great Britain. This represents:
- A reduction of 14 deaths from the 138 recorded in 2023/24
- A figure below the five-year average of 133 annual deaths
- The lowest fatal injury rate on record, at 0.37 deaths per 100,000 workers
While this is a positive development, the long-term rate of improvement has plateaued. The current figure is broadly consistent with pre-pandemic levels rather than representing a new downward trend, and the HSE and leading safety organisations are clear that every workplace death is preventable.
For broader context, the HSE also tracks fatal injuries on a rolling five-year average to smooth out the year-on-year variation that naturally occurs when dealing with relatively small absolute numbers. Across the most recent five-year period, an average of 133 workers per year have lost their lives in workplace accidents in Great Britain.
The leading causes of workplace death
HSE data consistently identifies the same hazard categories as the primary causes of worker fatalities, year after year. In 2024/25 the breakdown was:
| Cause of fatality | Deaths (2024/25) |
|---|---|
| Falls from height | 35 |
| Struck by a moving object | 18 |
| Trapped by something collapsing or overturning | 17 |
| Struck by a moving vehicle | 14 |
| Contact with moving machinery | 13 |
Falls from height — 35 deaths — were the single most common cause, accounting for 28% of all workplace fatalities. Falls from height have been the leading cause of workplace death for the majority of years since 2001/02.
These five causes together accounted for approximately 80% of all worker fatalities in 2024/25. Falls from height alone caused more deaths than being struck by a moving object and struck by a moving vehicle combined.
When taken as a five-year average, falls from height, being struck by moving vehicles, and contact with moving machinery represent three of the most persistently lethal hazards in the UK workplace — pointing clearly to the activities and environments where preventative effort must be concentrated.
In construction specifically, falls from height account for more than half of all sector fatalities across the five-year average — an extraordinary concentration of risk around a single hazard type.
Which industries have the highest fatality rates?
Workplace death risk is not evenly distributed. The data reveals stark disparities between sectors, both in terms of absolute numbers and in terms of rates adjusted for workforce size.
By number of fatalities (2024/25)
- Construction: 35 deaths — the highest of any sector, accounting for 28% of all worker fatalities
- Agriculture, forestry and fishing: 23 deaths
- Transportation and storage: 15 deaths — appearing in the top three for the first time in recent years
- Administrative and support services: 13 deaths
- Wholesale, retail, accommodation and food: 12 deaths
Construction and agriculture together accounted for 47% of all workplace deaths in 2024/25, despite employing only a small share of the total workforce.
By fatal injury rate (deaths per 100,000 workers)
- Agriculture, forestry and fishing: 8.01 — by a significant margin the most dangerous sector relative to workforce size. This rate is more than 22 times the all-industry average.
- Waste and recycling: 2.76 — consistently the second most dangerous sector by rate
- Construction: 1.65 — approximately five times the all-industry average
The distinction between absolute numbers and rate per worker matters significantly. While construction generates the highest raw count of deaths due to the scale of its workforce, agriculture is statistically far more dangerous for any individual working in it. A worker in agriculture is more than three times more likely to be killed than a construction worker, and 22 times more likely than the average across all industries.
Within agriculture, the persistent causes of death include heavy machinery accidents, tractor overturns, livestock incidents — particularly involving cattle — and the risks associated with lone working in remote environments where emergency response times are significantly extended.
Who is most at risk?
The fatality data reveals consistent and significant disparities in who bears the greatest risk of being killed at work.
Gender
An overwhelming 95% of workplace fatalities in 2024/25 were to male workers. This reflects the concentration of deaths in male-dominated industries — construction, agriculture, manufacturing, and transport — rather than any inherent difference in susceptibility. In 2025, approximately 1.76 million men were employed in construction compared to 318,000 women, illustrating the occupational exposure gap.
Age
Older workers are disproportionately at risk of workplace death:
- Workers aged 60–64 face a fatal injury rate approximately twice the all-ages average
- Workers aged 65 and over face a rate approximately four times higher than the workforce average
- Workers aged 60 and over accounted for around 40% of all fatalities in 2024/25, despite representing just 11–12% of the total workforce
This pattern likely reflects a combination of physical vulnerability, greater likelihood of working in traditional manual industries with high inherent risk, and potentially lower engagement with refresher training and updated safety practices.
Employment status
Self-employed workers face dramatically elevated risk:
- Self-employed workers make up approximately 15% of the UK workforce
- Yet they account for approximately 40% of all workplace fatalities
- In agriculture specifically, 66% of fatalities involve self-employed individuals
This disparity reflects several compounding factors: self-employed workers are less likely to receive formal safety induction and ongoing training, less likely to be closely supervised, more likely to make cost-driven decisions about equipment and PPE, and more likely to work alone — reducing the speed of emergency response when an incident occurs.
Deaths to members of the public
Workplace fatality statistics do not only cover workers. In 2024/25, a further 92 members of the public were killed in incidents connected to work activities — up from 87 the previous year and continuing a gradual increase.
These deaths cover members of the public who were present in a workplace but not working — including customers, visitors, and bystanders affected by work-related activities. The services sector accounts for the majority of public fatalities, given the volume of public interaction in retail, accommodation and food, transportation, health and social work, and public administration.
Employers have a legal duty under the Health and Safety at Work etc. Act 1974 to protect not only their employees but also members of the public who may be affected by their operations. The rising trend in public fatalities is a significant concern and underscores that the duty of care extends well beyond the workforce.
Occupational disease deaths: the hidden toll
The 124 accident fatalities recorded in 2024/25 represent only a fraction of the true annual death toll attributable to work. When occupational diseases caused by past workplace exposures are included, the figure rises dramatically.
The HSE estimates that approximately 13,000 people die every year from occupational diseases linked to past exposures at work. Of these:
- Around 11,000 deaths per year are attributable to occupational lung diseases, including:
- Chronic Obstructive Pulmonary Disease (COPD): 35% of occupational lung disease deaths
- Non-asbestos related lung cancer: 23%
- Asbestos-related lung cancer: 20%
- Mesothelioma: 20%
- Other diseases: 3%
- Mesothelioma — a cancer caused almost exclusively by past asbestos exposure — killed 2,218 people in 2023, down from a peak average of 2,508 per year over 2011–2020. Current deaths reflect exposures that typically occurred before the 1980s, and annual numbers are projected to continue declining.
- Asbestos was widely used in construction, shipbuilding, and manufacturing throughout the mid-twentieth century, and many of those dying now were exposed during that era. With asbestos still present in a large proportion of UK buildings built before 2000, ongoing exposure management remains critical.
These occupational disease deaths are excluded from the HSE’s annual accident fatality statistics because they fall outside the scope of RIDDOR — but they represent by far the largest component of work-related mortality in the UK and should be understood as part of the complete picture.
The long-term trend: progress and plateau
The long-term trajectory of workplace fatalities in the UK tells a story of genuine and substantial progress, followed by a concerning decade-long plateau:
| Year | Worker deaths |
|---|---|
| 1981 | 495 — the earliest year for which comparable data exists |
| 2004/05 | 223 — a reduction of more than 50% over 23 years |
| 2015/16 | 144 |
| 2023/24 | 138 |
| 2024/25 | 124 — the lowest rate on record |
The rate of fatal injury has fallen from 2.1 per 100,000 workers in 1981 to 0.37 in 2024/25 — a reduction of more than 80% over four decades. This represents one of the most significant improvements in occupational safety of any developed economy.
However, the rate of improvement has stalled over the past decade. Excluding pandemic-affected years, the annual death toll has remained broadly flat since around 2015. The current figure of 124 is broadly in line with pre-pandemic levels rather than representing a continuation of the historic downward trend.
This plateau suggests that the relatively straightforward gains from improved regulation, better equipment, and basic training have largely been realised. Further progress will require targeted intervention on the specific hazards, sectors, and workforce groups that continue to generate disproportionate harm — particularly falls from height, agricultural machinery, and the self-employed.
How does the UK compare internationally?
Despite the plateau in progress, the UK maintains one of the strongest workplace safety records of any comparable economy:
- Great Britain’s fatal injury rate of 0.37 per 100,000 workers is one of the lowest of any large economy globally.
- The UK compares favourably with France, Spain, Italy, Poland, and the EU-27 average on both fatal and non-fatal injury rates.
- The HSE’s 10-year strategy (2022–2032) aims to maintain Great Britain’s status as one of the safest countries in the world to work, rather than setting a specific numerical target for further reduction — a position that reflects confidence in the current trajectory but has drawn criticism from some unions and safety campaigners who argue more ambition is needed.
- Despite the UK’s strong comparative position, the HSE is clear that no workplace death is acceptable and that every fatality recorded each year was preventable.
What the fatality statistics do not include
Understanding the scope and limitations of the HSE’s fatality data is important for anyone using these figures as a reference:
- The statistics cover work-related accident deaths reported under RIDDOR — they do not include deaths from occupational diseases.
- They exclude road traffic deaths where workers were travelling on public roads as part of their job (e.g. delivery drivers killed in road accidents), as these fall under the remit of the Department for Transport rather than the HSE.
- They exclude deaths attributed to natural causes (such as heart attacks) unless there is a clear direct link to a work-related accident.
- They exclude patients and service users in health and social care premises regulated by the Care Quality Commission in England.
- They cover Great Britain (England, Scotland, and Wales) — Northern Ireland has separate health and safety legislation and statistics.
- The approximately 13,000 annual occupational disease deaths are published separately and are not reflected in the headline fatality figures.
Employer legal duties and RIDDOR
Employers in the UK have clear legal obligations both to prevent workplace deaths and to report them when they occur.
Prevention
- The Health and Safety at Work etc. Act 1974 — places a general duty on employers to ensure, so far as is reasonably practicable, the health, safety, and welfare of all employees and others affected by their work.
- The Management of Health and Safety at Work Regulations 1999 — require employers to carry out suitable and sufficient risk assessments and implement appropriate control measures.
- The Work at Height Regulations 2005 — require employers to prevent falls from height, the leading cause of workplace death, through proper planning, supervision, and use of appropriate equipment.
- The Provision and Use of Work Equipment Regulations 1998 (PUWER) — require that work equipment is safe, maintained, and used only by people who have received adequate training.
- The Corporate Manslaughter and Corporate Homicide Act 2007 — enables prosecutions of organisations where a gross breach of a duty of care results in death, with unlimited fines and publicity orders as penalties.
Reporting
- RIDDOR 2013 — requires employers to report fatal injuries to workers immediately by calling the Incident Contact Centre, and to report deaths of members of the public arising from work activities. Failure to report is a criminal offence.
Where a workplace death leads to HSE investigation and subsequent prosecution, organisations face unlimited fines. Individual directors and managers can face personal liability and, in the most serious cases, custodial sentences.
Preventing workplace fatalities: what the evidence shows
The causes of workplace death are well understood, and the interventions that prevent them are well established. The persistent concentration of fatalities in a small number of hazard categories and industries points clearly to where effort must be focused.
Falls from height — responsible for more than a quarter of all workplace deaths every year — are preventable through proper planning before any work at height begins, selection of the right equipment (working platforms, guardrails, harnesses), adequate supervision, and comprehensive training. The Work at Height Regulations 2005 provide the legal framework, and the HSE has extensive practical guidance.
Vehicle and machinery incidents — collectively responsible for around a quarter of all fatalities — require robust pedestrian segregation in workplaces where vehicles and people share space, clear traffic management plans, visibility aids, and training for both operators and those working in proximity to moving vehicles.
Agriculture — the most dangerous sector by rate — requires particular attention to tractor and machinery safety, livestock handling procedures, lone worker monitoring, and the provision of accessible training for self-employed workers who may not have the same institutional safety support as employees of larger organisations.
Self-employed workers — who account for 40% of fatalities despite being 15% of the workforce — require specific outreach. This means ensuring that self-employed contractors have access to induction, risk assessment information, and appropriate training before starting work on any site.
Older workers — who face fatal injury rates up to four times the workforce average — benefit from targeted risk assessment that accounts for age-related changes in strength, balance, and reaction time, as well as regular refresher training and a workplace culture that does not penalise reporting of concerns.
Written by workplace safety experts
This guide was produced by the team at Manual Handling Training, a UK provider of RoSPA-approved and CPD-accredited online health and safety training. We publish data guides like this one because we believe that clear, accurate, and accessible safety information saves lives — and because the workers and employers who use our training deserve to understand the scale of the challenge that good workplace safety practice is designed to address.
Sources & references
- Health and Safety Executive (HSE) – Work-Related Fatal Injuries in Great Britain 2024/25
- HSE Media Centre – Latest Annual Work-Related Fatalities Published (July 2025)
- Health and Safety Executive (HSE) – Health and Safety at Work: Summary Statistics for Great Britain 2025
- HSE – Work-Related Ill Health and Occupational Disease in Great Britain
- HSE – Historical Picture: Trends in Work-Related Ill Health and Workplace Injury in Great Britain
- HSE – Reporting of Injuries, Diseases and Dangerous Occurrences Regulations (RIDDOR) 2013
- HSE – Work at Height Regulations 2005
- HSE – HSE Strategy 2022–2032: Protecting People and Places
Related guides
Make sure your team is trained in safe manual handling.
Explore the Manual Handling Training Course →
Mark writes about workplace health & safety, manual handling and accredited online training for Manual Handling Training, part of Online CPD Academy.