Workplace injury statistics UK
Workplace injuries remain one of the most significant public health and economic challenges facing the UK. Every year, hundreds of thousands of workers are hurt, millions of working days are lost, and tens of billions of pounds are absorbed by businesses, the NHS, and the wider economy.
Despite decades of legislation, enforcement, and safety awareness campaigns, the latest data shows that progress has stalled. Work-related ill health is rising above pre-pandemic levels, non-fatal injuries are increasing, and certain industries continue to record deeply concerning rates of serious and fatal harm.
This guide brings together the latest verified UK workplace injury statistics from the Health and Safety Executive (HSE) and other authoritative sources, to give employers, safety professionals, HR teams, legal practitioners, and workers a clear picture of the current landscape.
Key facts & figures (overview)
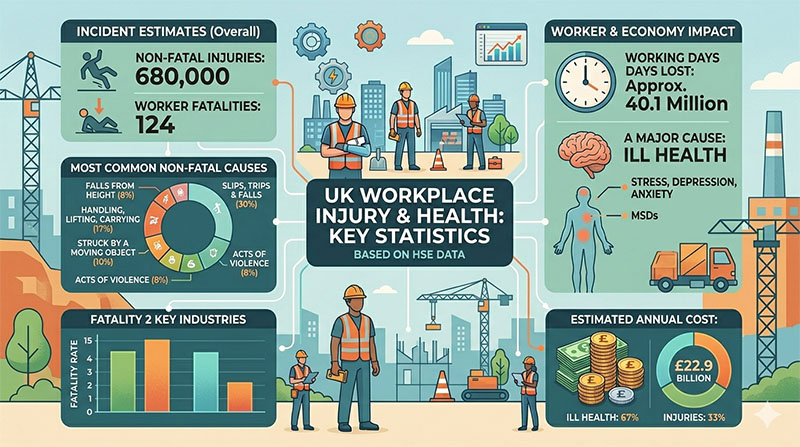
- 680,000 workers sustained a non-fatal workplace injury in Great Britain in 2024/25 — up from 604,000 the previous year, an increase of approximately 12.6%.
- 124 workers were killed in work-related accidents in 2024/25, down from 138 the year before and the lowest fatal injury rate on record.
- 92 members of the public died as a result of work-related activities in 2024/25.
- 1.9 million workers suffered from work-related ill health (new or long-standing) in 2024/25.
- 40.1 million working days were lost due to work-related illness and workplace injury combined.
- £22.9 billion is the estimated total cost of workplace injuries and new cases of work-related ill health (2023/24 reference year).
- 59,219 employer-reported injuries under RIDDOR — significantly lower than the self-reported figure, reflecting a persistent gap in formal reporting.
- 13,000 deaths per year are estimated to be linked to past workplace exposures, primarily from occupational lung diseases such as mesothelioma and work-related lung cancer.
How many people are injured at work each year?
According to the Labour Force Survey — the HSE’s preferred data source — approximately 680,000 workers sustained a non-fatal workplace injury in 2024/25. This figure is notably higher than the 604,000 recorded in 2023/24 and continues a concerning upward trend in self-reported injuries.
By contrast, the number of injuries formally reported by employers under RIDDOR was 59,219 — a fall of around 5% on the previous year. This significant gap between self-reported and employer-reported injuries suggests that a large proportion of workplace injuries — particularly lower-severity incidents — are either not being formally reported or do not meet the RIDDOR reporting threshold.
The non-fatal workplace injury rate in 2024/25 stood at 2,070 per 100,000 workers (2.1%). While this is substantially lower than the rate of around 4,000 per 100,000 recorded in 2000/01, progress has now plateaued, with rates broadly flat compared to pre-pandemic 2018/19 levels.
The most common causes of workplace injury
HSE data consistently identifies a small number of hazard categories responsible for the majority of non-fatal workplace injuries. In 2024/25 the breakdown was:
- Slips, trips and falls on the same level: 30% of all non-fatal injuries — the single most common cause
- Handling, lifting or carrying: 17% — the second most common cause
- Struck by a moving object: 10%
- Acts of violence: 8%
- Falls from height: 8%
Falls from height, while accounting for a smaller proportion of non-fatal injuries, are the leading cause of fatal workplace injuries, responsible for 28% of all worker deaths in 2024/25.
Fatal workplace injuries in the UK
124 workers were killed at work in Great Britain in 2024/25 — a reduction of 14 on the previous year and the lowest fatal injury rate ever recorded, at 0.37 deaths per 100,000 workers. For context, the rate in 1981 was 2.1 per 100,000 — meaning the risk of being killed at work has fallen by more than 80% over four decades.
Despite this long-term progress, serious risks remain:
- Falls from height caused 35 deaths — the single largest cause, accounting for 28% of all worker fatalities
- Being struck by a moving object caused 18 deaths
- Being struck by a moving vehicle caused 14 deaths
- These three causes together accounted for 60% of all fatal workplace injuries
Other notable findings on fatal injuries:
- 95% of workplace fatalities in 2024/25 were to male workers
- Workers aged 60 and over accounted for approximately 40% of fatalities, despite representing just 11% of the total workforce
- Self-employed workers face significantly higher fatal injury rates than employees — across all industries, the fatal injury rate for the self-employed is 1.0 per 100,000 compared to 0.3 for employees
- An additional 92 members of the public died as a result of work-related incidents in 2024/25 — an increase on the 87 recorded the previous year
Which industries are most dangerous?
Workplace injury risk is not evenly distributed. Certain sectors consistently record far higher rates of injury and fatality than others.
By number of fatalities (2024/25)
| Sector | Deaths (2024/25) |
|---|---|
| Construction | 35 deaths — the highest of any sector |
| Agriculture, forestry and fishing | 23 deaths |
| Transportation and storage | 15 deaths |
| Administrative and support services | 13 deaths |
| Wholesale, retail, accommodation and food | 12 deaths |
By fatal injury rate (per 100,000 workers)
| Sector | Fatal injury rate (per 100,000) |
|---|---|
| Agriculture, forestry and fishing | 8.01 — by far the most dangerous sector relative to workforce size |
| Waste and recycling | 2.76 |
| Construction | 1.65 |
Agriculture’s high rate reflects a combination of heavy machinery, livestock hazards, remote working environments, lone working, and a high proportion of self-employed workers with limited access to training and support.
For non-fatal injuries, the sectors with the highest rates compared to the all-industry average include construction, agriculture, manufacturing, transportation and storage, and human health and social work.
Work-related ill health
Workplace injury statistics tell only part of the story. Work-related ill health affects far more workers and causes a greater total burden of lost working days than physical injuries alone.
In 2024/25:
- 1.9 million workers suffered from work-related ill health — up from 1.7 million the previous year and higher than pre-pandemic levels
- 730,000 new cases of work-related ill health were recorded, up from 609,000 the previous year
- Stress, depression and anxiety accounted for 52% of all work-related ill health cases, affecting 964,000 workers
- Musculoskeletal disorders (MSDs) accounted for 27% of cases, affecting 511,000 workers
- Work-related ill health resulted in 35.7 million working days lost — up from 29.6 million the previous year
- 22.1 million of those days were lost specifically to stress, depression or anxiety — up from 16.4 million the previous year
Sectors reporting statistically higher rates of work-related ill health than the national average include public administration and defence, education, and human health and social work.
Working days lost to workplace injury and illness
The combined burden of workplace injury and work-related ill health on UK productivity is enormous:
- 40.1 million working days were lost in 2024/25 — an increase of approximately 19% compared to recent years
- 35.7 million days were lost to work-related ill health
- 4.1 million days were lost specifically to non-fatal workplace injuries
- Each worker suffering a work-related musculoskeletal disorder loses an average of 14 working days
- Workers affected by stress, depression or anxiety are taking longer off per case on average — suggesting that mental health-related absences are becoming more severe
These figures do not capture the full economic impact, which also includes reduced productivity among those who remain at work while unwell, management time, recruitment and retraining costs, and the administrative burden of RIDDOR reporting and HSE investigations.
The cost of workplace injuries to UK businesses
The financial case for investing in workplace safety is clear:
- The total estimated cost of workplace injuries and new cases of work-related ill health is £22.9 billion per year (2023/24 reference year)
- This cost is shared between employers, employees, and the government
- Ill health accounts for 67% of the total cost burden, with injuries accounting for the remaining 33%
- Manual handling injuries alone cost UK businesses an estimated £3.5 billion per year
- Severe back injury compensation claims can reach up to £196,450 depending on the nature and permanence of the injury
- Workers injured in the workplace typically take between 7 and 21 days off, depending on the type and severity of injury
These costs exclude long-latency diseases such as cancers caused by past occupational exposures, which add substantially to the total burden on the NHS and public finances.
Workplace injuries: long-term trends
The long-term picture shows genuine progress, but with important caveats:
- Fatal workplace injuries have fallen dramatically — from 495 deaths in 1981 to 124 in 2024/25, a reduction of around 75%
- The UK’s fatal injury rate is now one of the lowest of any large economy in the world
- Non-fatal injury rates have also fallen significantly over several decades — from around 4,000 per 100,000 workers in 2000/01 to around 2,070 in 2024/25
- However, progress on non-fatal injuries has now plateaued, with rates broadly flat since 2018/19
- Work-related ill health rates, which had been declining before 2020, are now above pre-pandemic levels and rising
- The number of working days lost increased by approximately 19% in 2024/25, reversing years of gradual improvement
The stalling of progress on ill health and non-fatal injuries, combined with rising lost working days, represents a significant challenge for UK employers and regulators heading into the latter half of the decade.
How does the UK compare internationally?
Despite recent stalling of progress, the UK remains one of the safest countries in the world to work:
- Great Britain’s fatal injury rate of 0.37 per 100,000 workers compares favourably with most other large European economies
- UK non-fatal injury rates are comparable to Germany and lower than France, Spain, Italy, and Poland, as well as the EU-27 average
- Globally, the International Labour Organization (ILO) estimates that 2.3 million workers die from work-related causes every year — around 380,000 from accidents and 1.9 million from occupational diseases
The UK’s relatively strong performance reflects decades of regulatory development, enforcement activity by the HSE, and a broad culture of workplace safety management — but the recent plateau in key indicators suggests that further improvement will require renewed effort.
Employer reporting vs. self-reporting: understanding the gap
One of the most important nuances in UK workplace injury statistics is the significant difference between self-reported and employer-reported figures:
- Self-reported injuries (Labour Force Survey): 680,000 in 2024/25
- Employer-reported injuries (RIDDOR): 59,219 in 2024/25
This gap — of over 600,000 incidents — reflects several factors. Many injuries are minor and fall below the RIDDOR threshold. Some employers do not report injuries they are required to. And some workers do not report injuries to their employer at all.
The HSE uses the Labour Force Survey as its primary measure precisely because it captures the broader picture, including injuries that never enter the formal reporting system.
Workplace injury law in the UK
Employers in the UK operate within a comprehensive legal framework designed to protect workers from injury and ill health:
- The Health and Safety at Work etc. Act 1974 — the foundational piece of legislation, placing a general duty on employers to ensure the health, safety, and welfare of all employees
- The Management of Health and Safety at Work Regulations 1999 — require employers to carry out suitable and sufficient risk assessments and implement appropriate controls
- RIDDOR 2013 — requires employers to formally report specified workplace injuries, dangerous occurrences, and occupational diseases to the HSE
- The Manual Handling Operations Regulations 1992 — require employers to avoid, assess, and reduce the risk of injury from manual handling tasks
- The Workplace (Health, Safety and Welfare) Regulations 1992 — set minimum standards for the physical workplace environment
Failure to comply with these duties can result in HSE investigation, improvement or prohibition notices, and criminal prosecution. In serious cases, directors and senior managers can face personal liability.
Reducing workplace injuries: what works
For employers
- Carry out regular, thorough risk assessments across all work activities
- Ensure all workers receive appropriate health and safety training for their role
- Report injuries and near misses under RIDDOR — and learn from them
- Address work-related ill health with the same urgency as physical injuries
- Provide mechanical aids and ergonomic equipment to reduce physical strain
- Foster a safety culture where workers feel able to raise concerns without fear
For workers
- Report all injuries, near misses, and early symptoms of ill health promptly
- Use the equipment and protective measures provided by your employer
- Attend and engage with health and safety training
- Apply safe manual handling techniques at all times
- Raise concerns about unsafe practices or working conditions
Written by workplace safety experts
This guide was produced by the team at Manual Handling Training, a UK provider of RoSPA-approved and CPD-accredited online health and safety training. Our courses are used by businesses across construction, warehousing, healthcare, and logistics to meet their legal obligations and protect their people. Because workplace safety is what we do every day, we’re well placed to track the latest HSE data and present it clearly for employers, safety professionals, and workers alike.
Sources & references
- Health and Safety Executive (HSE) – Health and Safety at Work: Summary Statistics for Great Britain 2025
- HSE – Work-Related Fatal Injuries in Great Britain 2024/25
- HSE – Work-Related Musculoskeletal Disorders Statistics in Great Britain 2025
- HSE – Costs to Great Britain of Workplace Injuries and New Cases of Work-Related Ill Health 2023/24
- HSE – Industries: Work-Related Injury and Ill Health by Sector
- International Labour Organization (ILO) – Safety and Health at Work
Related guides
Make sure your team is trained in safe manual handling.
Explore the Manual Handling Training Course →
Mark writes about workplace health & safety, manual handling and accredited online training for Manual Handling Training, part of Online CPD Academy.